Student-built environmental technology project

AI Footprint Lab

AI feels invisible, but every answer depends on real-world infrastructure: servers, electricity, cooling, chips, and data centers.

The mission is to help students understand AI in a balanced way: what it makes possible, what resources it uses, and how better design can reduce long-term environmental and economic costs.

Image: PxHere, CC0 Public Domain.

AI infrastructure flowA prompt travels through data-center servers, electricity use, and cooling before returning an answer.PromptA user asks for helpData centerServers and chips process itElectricityPower keeps hardware runningCoolingHeat has to be removedAnswerThe response returns quickly

Hidden infrastructure of AI

AI tools feel instant, but they depend on data centers, servers, chips, electricity, cooling, and networks.

Benefits and trade-offs

AI can support learning, science, accessibility, and productivity while also raising questions about energy, water, cost, and reliability.

Future solutions

Smaller models, efficient chips, renewable power, better cooling, and responsible use can help reduce AI's footprint over time.

Overview

AI has a physical footprint

AI tools feel instant, but they run through data centers packed with chips, cooling systems, backup power, and network equipment. Their electricity demand and water use can affect grids, climate goals, and communities near major facilities.

Start with the source-backed numbers, then dig into the hidden costs behind AI infrastructure or use the interactive comparison to explore low, likely, and high estimates.

AI Footprint by the Numbers

These numbers are real, and future data-center impact is uncertain enough that low, likely, and high estimates matter.

Why these numbers should get our attention

Energy and water use at data-center scale can affect real communities. Large electricity demand can pressure local grids and climate goals, while large water demand can become serious in dry regions or places with limited public reporting. The concern is not that AI is automatically bad; it is that growth this fast needs careful planning, cleaner power, efficient hardware, and honest local data.
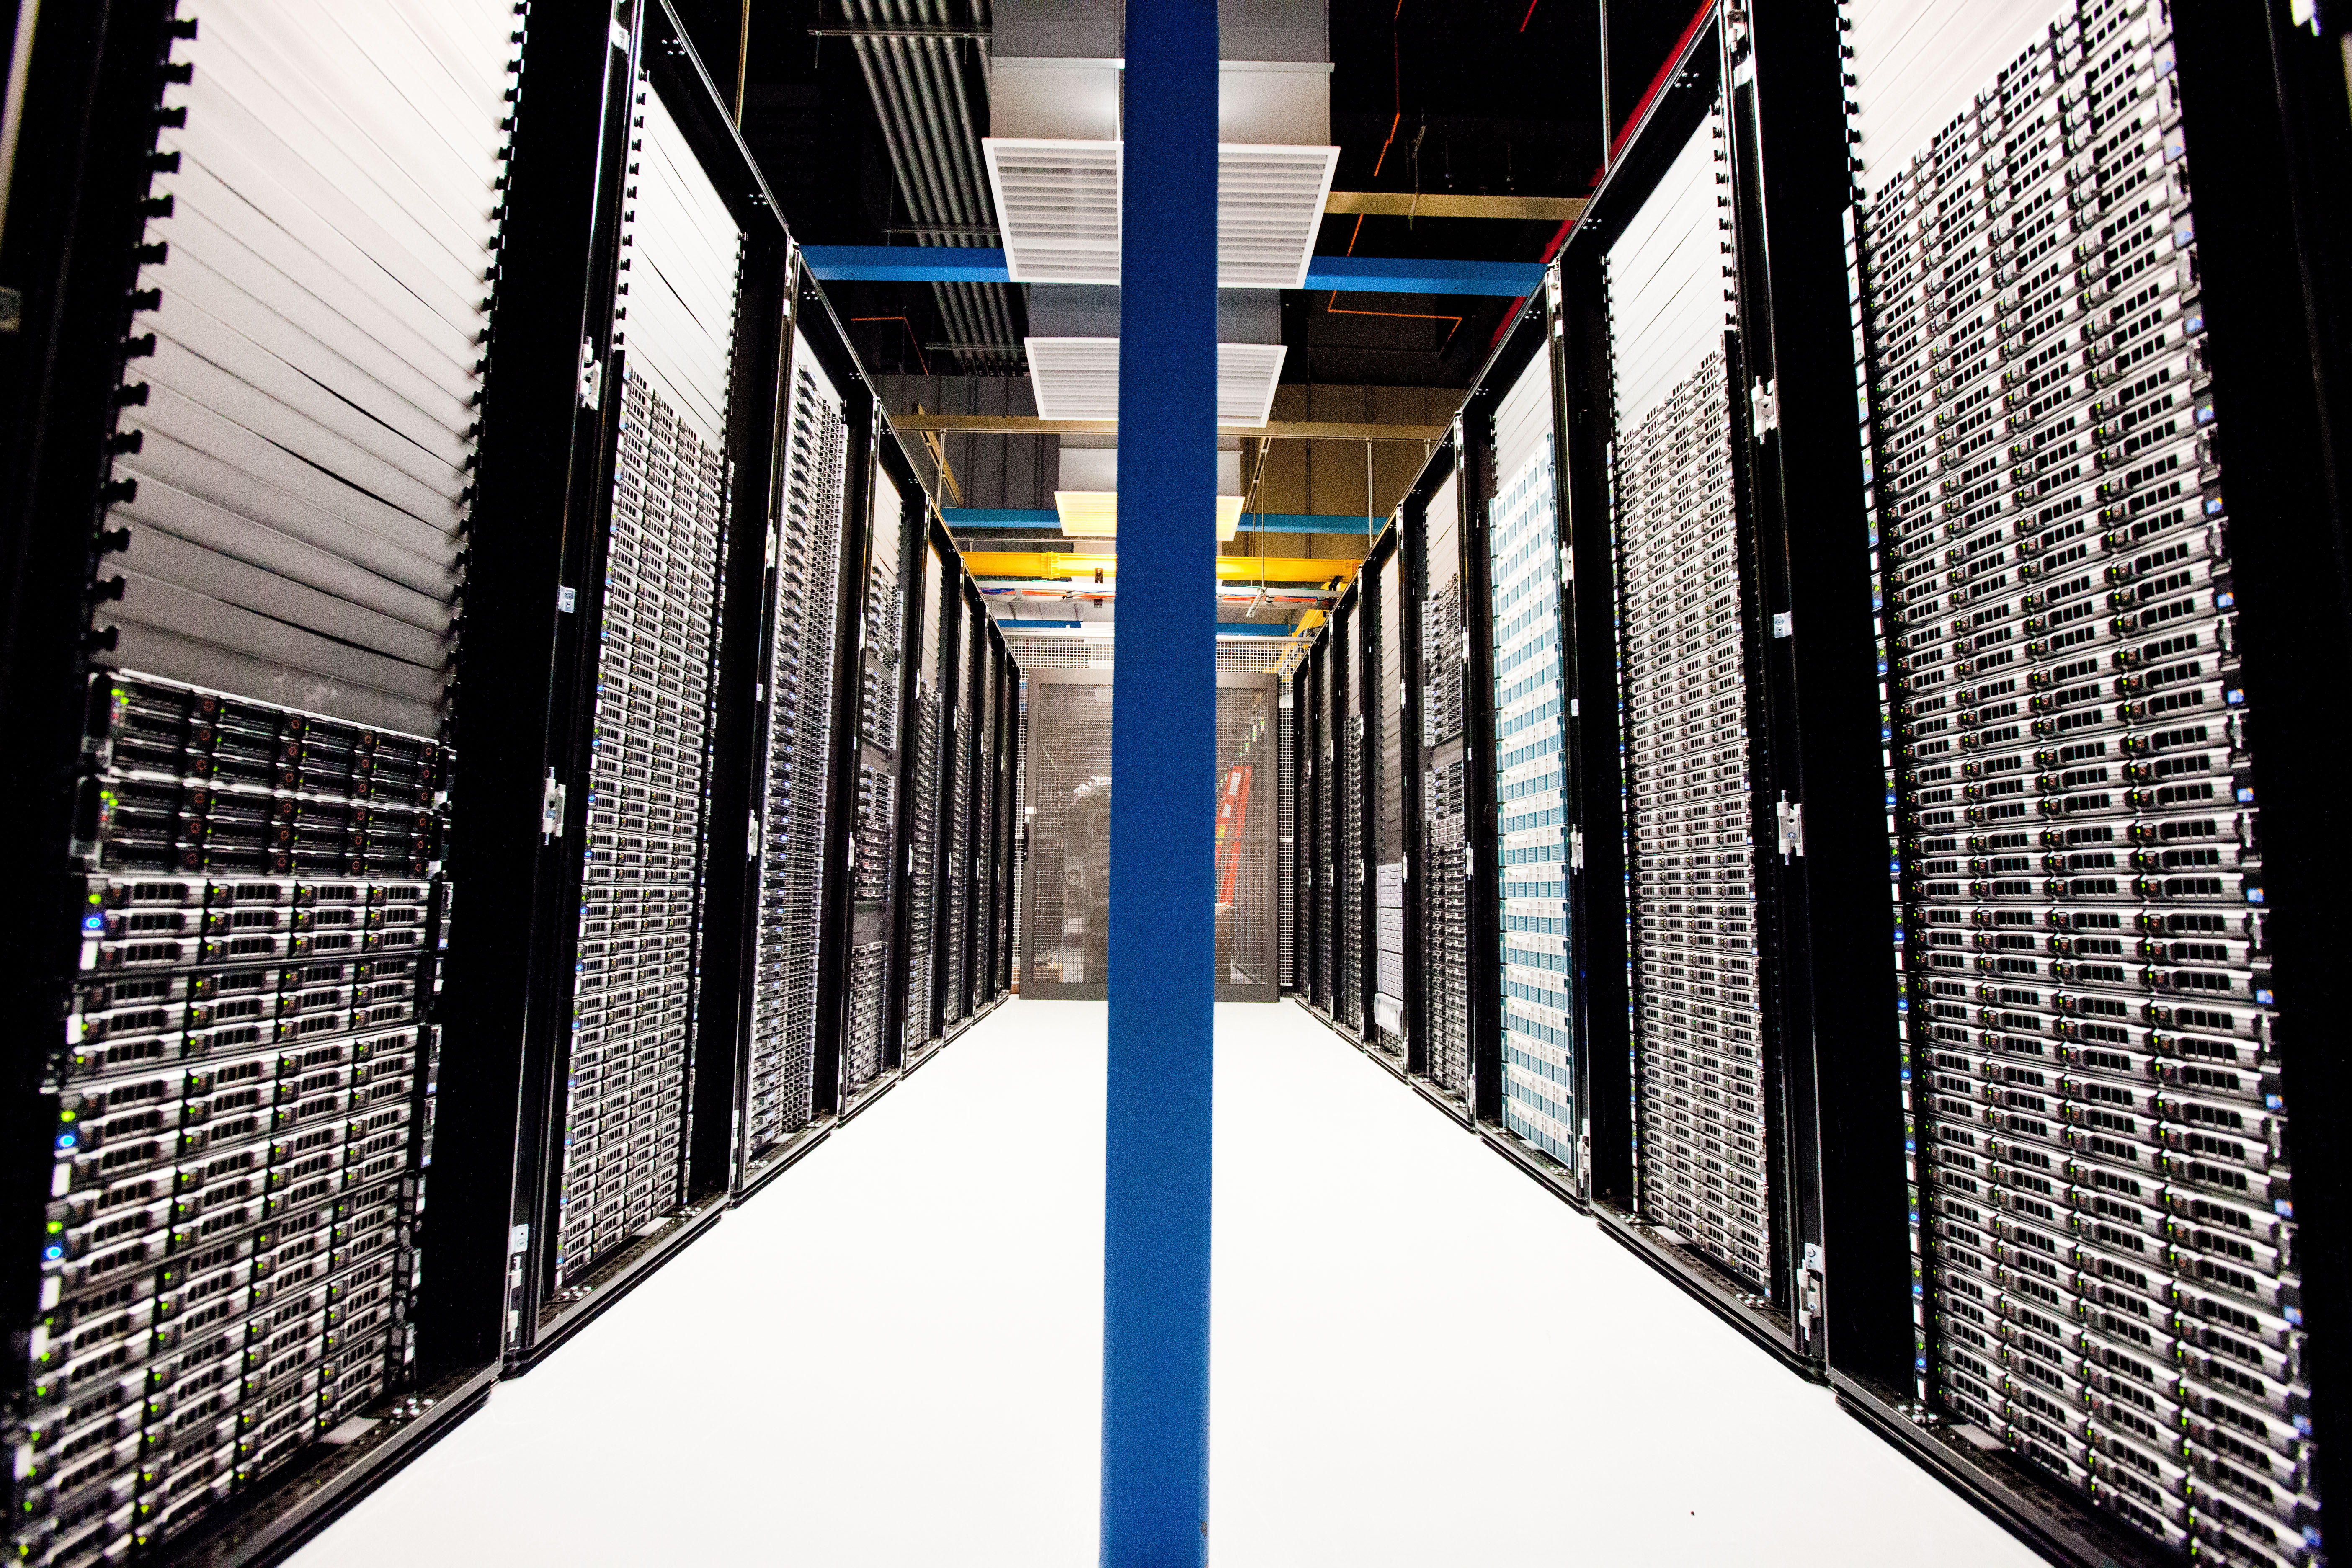
A long aisle of black server racks inside a data center.

Real infrastructure

AI feels like software, but it runs on rooms full of hardware.

Photos help make the invisible visible: each answer depends on racks of servers, network equipment, cooling systems, backup power, and the grid outside the building.

Image: Helpameout / Wikimedia Commons, CC BY-SA 3.0.

energy

2025

Estimated global data-center electricity use

415TWh in 2024

What this means: 415 TWh is about 415 billion kWh, roughly enough electricity for 38 million average U.S. homes for one year.

Why this is concerning: Demand this large can strain power grids, require new power plants or transmission lines, and make it harder to cut emissions if the electricity comes from fossil fuels.

Data centers used about as much electricity as a medium-sized country in 2024.

International Energy Agency, Energy and AI

Source caveat: This covers data centers broadly, not only AI. Estimates vary by data-center type and accounting method.

energy

2025

Projected global data-center electricity use

945TWh by 2030

What this means: 945 TWh is about 945 billion kWh, roughly enough electricity for 88 million average U.S. homes for one year.

Why this is concerning: A more-than-doubling projection means utilities, communities, and governments may have only a few years to plan for much higher electricity demand.

IEA projects global data-center electricity demand could more than double by 2030 in its base case.

International Energy Agency, Energy and AI

Source caveat: This is a projection, not a guarantee. Future demand depends on AI adoption, hardware efficiency, software efficiency, and energy-system bottlenecks.

energy

2024

Projected U.S. data-center electricity growth

Double or tripleby 2028

What this means: Double or triple means a fast-growing load on the grid, similar to adding many large cities worth of electricity demand.

Why this is concerning: Fast local growth can raise electricity prices, delay clean-energy goals, and force communities to decide quickly who pays for new grid infrastructure.

DOE says domestic data-center electricity demand could grow very quickly this decade.

U.S. Department of Energy and Lawrence Berkeley National Laboratory

Source caveat: The public DOE release summarizes the LBNL report. Use the full LBNL report for detailed scenario tables if adding more precise U.S. values.

water

2025

Large data-center water consumption example

Up to 5 milliongallons per day

What this means: 5 million gallons per day is about 19 million one-gallon jugs each day, or enough daily water for roughly 10,000 to 50,000 people using 100 to 500 gallons per person.

Why this is concerning: Water use at this scale can matter a lot in drought-prone areas, because data centers may compete with homes, farms, rivers, and emergency reserves.

A very large facility can use water at a scale comparable to a town.

Environmental and Energy Study Institute

Source caveat: This is an upper-end large-facility example. Water use depends heavily on climate, cooling system, facility size, chip density, and whether non-potable or recycled water is used.

water

2021

U.S. data-center water-use uncertainty

1.7 billionliters per day

What this means: 1.7 billion liters per day is about 449 million gallons, or around 680 Olympic-size swimming pools each day.

Why this is concerning: The uncertainty itself is a warning sign: if many operators do not measure or report water use, communities cannot easily judge local risk before approving new facilities.

Data-center water use is large enough to matter locally, but facility-level transparency is limited.

David Mytton, npj Clean Water

Source caveat: The paper notes that less than one third of data-center operators measured water consumption at the time. This makes precise comparisons difficult.

efficiency

2025

Efficiency could lower future demand

More than 15%energy savings by 2035

What this means: A 15% efficiency improvement on a 945 TWh projection would save about 142 TWh, roughly a year of electricity for 13 million average U.S. homes.

Why this is concerning: Efficiency helps, but it may not solve the problem if AI demand grows faster than efficiency improves. Total impact can still rise even when each machine gets better.

Better hardware, software, and infrastructure could reduce projected data-center electricity demand.

International Energy Agency, Energy and AI

Source caveat: Efficiency savings are conditional. If AI demand grows faster than efficiency improves, total energy use can still rise.

context

2024

Average U.S. home electricity use

10,791kWh per year

What this means: 10,791 kWh per year is about 30 kWh per day for one average U.S. home.

Why this is concerning: This home comparison shows why TWh numbers are not small: one data-center statistic can equal the yearly electricity use of millions of households.

One average U.S. home uses about 10.8 megawatt-hours of electricity each year.

U.S. Energy Information Administration

Source caveat: Household electricity use varies by state, home size, climate, and whether a home has solar panels.

Electricity scale

Data-center electricity is measured in country-sized numbers

Source: IEA
Data-center electricity comparisonA bar chart comparing 415 terawatt-hours in 2024 with 945 terawatt-hours by 2030, including approximate U.S. home electricity equivalents.Estimated global data-center electricity use415 TWhroughly 38M homesof average U.S. home electricity for one yearProjected global data-center electricity use945 TWhroughly 88M homesof average U.S. home electricity for one year0 TWh315 TWh630 TWh945 TWh
A schematic of electricity generation, transmission, and distribution.

The grid image shows why data-center electricity is not just a private facility issue.

More demand can require generation, transmission, transformers, and local distribution upgrades.

Image: MBizon / Wikimedia Commons, CC BY 3.0.

The bar lengths are generated from the same source-backed values used by the statistic cards.
A black faucet silhouette with a single blue water drop.

Water scale

Cooling can turn invisible computing into local water demand

Image: Tommaso.sansone91 / Wikimedia Commons, CC0 Public Domain.

Source: EESI
Water-use scale comparisonA pictogram showing that five million gallons per day can be comparable to the daily water use of a small town, plus a national water-use estimate in Olympic pool equivalents.Large facility exampleUp to 5 million gallons per day1M gal1M gal1M gal1M gal1M galabout 10,000 to 50,000people using 100 to 500 gallons per day680 Olympic-size pools per dayBased on 1.7 billion liters per day
The blocks are explanatory scale markers, not a claim that every facility uses this much water.

Hidden Cost Of AI

AI does not live in the cloud. It lives somewhere.

Every AI answer depends on physical infrastructure: land, buildings, chips, electricity, cooling, water systems, roads, substations, and people who live nearby. The impact depends on where a data center is built and how it is powered, cooled, permitted, and governed.

land

Land and habitat pressure

Data centers need more than a building. Large campuses can also require substations, transmission upgrades, roads, stormwater systems, fencing, and backup power. If a site replaces forest, farmland, or habitat, the local impact is bigger than the server room itself.

Local question: Is the project reusing industrial land, or is it converting forest, farmland, or habitat?

Better planning: Prefer reused or lower-impact sites, protect tree canopy and habitat, and require clear land-use review.

Hyperscale data-center siting analysis

air

Air pollution from onsite power

Some fast buildouts use onsite gas turbines or backup generators while grid connections catch up. That can raise concerns about nitrogen oxides, smog-forming pollution, and local health.

Local question: Will the facility use temporary or permanent fossil-fuel power near neighborhoods already carrying pollution burdens?

Better planning: Require transparent air permits, cleaner power plans, monitoring, and enforceable limits before operation.

AP News on xAI Memphis

water

Cooling and water pressure

Dense computing hardware creates heat. Cooling can use air, water, liquid systems, recycled water, or a mix, and the local impact depends on climate, facility design, and water stress.

Local question: Does the cooling plan use public drinking water, recycled water, closed loops, or another lower-pressure source?

Better planning: Use recycled or non-potable water where appropriate, publish water-use data, and avoid worsening local scarcity.

EESI data-center water overview

grid

Grid buildout and utility costs

AI data centers can require new substations, transmission upgrades, transformers, and power contracts. Communities may ask who pays and whether clean-energy goals are affected.

Local question: Will grid upgrades benefit the public, or mostly serve one private load while shifting costs to others?

Better planning: Make utility planning public, pair growth with clean-power procurement, and explain ratepayer protections.

Guidi et al. 2024

community

Community consent and transparency

A data center can bring jobs, tax revenue, and infrastructure investment, but nearby residents may also face noise, construction traffic, pollution worries, or limited public notice.

Local question: Did residents have enough time, data, and public meetings to understand the trade-offs before approval?

Better planning: Hold early public meetings, publish permits and resource estimates, and track benefits and burdens by neighborhood.

AP News on xAI Memphis

hardware

Hardware and e-waste

AI depends on chips, servers, networking equipment, and cooling hardware. Manufacturing and replacing that equipment creates material, energy, mining, and e-waste questions.

Local question: Does the project explain hardware lifetimes, repair, reuse, recycling, and supply-chain impacts?

Better planning: Design for longer hardware life, reuse equipment where possible, and report responsible recycling practices.

MIT Technology Review on AI footprint

AI prompt -> physical footprint

A quick answer still depends on a real place

AI prompt to physical footprintA prompt flows through GPUs, electricity, cooling, land infrastructure, and local community impacts.PromptA user asks for helpGPUsSpecialized chips do theworkElectricityPower flows through thegridCoolingHeat has to leaveLandBuildings andsubstations take spaceCommunityLocal people live withthe trade-offs
The point is not that every project causes every impact. It is that AI systems depend on choices that happen in real communities.

Case study

Case Study: xAI in Memphis

The xAI Memphis controversy shows why AI infrastructure is also a community-governance issue: fast buildouts can raise questions about air permits, onsite power generation, local health, transparency, and who benefits from the project.

What happened

xAI's Memphis supercomputer project drew attention because reports described gas turbines, air-permit questions, public comments, and concerns from nearby residents and environmental groups.

Why it matters

The controversy shows that AI infrastructure is also a community-governance issue: fast buildouts can raise questions about air pollution, grid stress, transparency, and who benefits.

What better planning asks

A stronger process explains permits, power sources, cooling choices, public-health safeguards, local benefits, and whether the facility adds burdens to communities already facing environmental stress.

Community concerns: Residents and environmental groups raised air-quality, permitting, grid-stress, public comment, and nearby-neighborhood concerns.

Claimed benefits: xAI and local officials pointed to tax revenue, jobs, substation investment, and water-recycling investment.

Read the AP News case study source

Important caveat: Not every data center has the same footprint. A facility built on reused industrial land with clean power, strong cooling design, and public reporting is different from one built quickly with fossil-fuel backup power near already burdened communities. Data centers can create land-use pressure; in some locations, that may mean tree clearing, farmland conversion, habitat fragmentation, or new power infrastructure.

Interactive comparison

Compare low, likely, and high AI infrastructure estimates

Choose a region, scenario, and output to see the range behind each estimate. The likely value is the center of the classroom model.

AI base growth

Uses published data-center growth projections without assuming a special cooling improvement.

  • Represents data-center growth without making a strong claim about one cooling method.
  • Use this as the default comparison against no added AI workload.

Cooling trade-off

Cooling choices move pressure between water and electricity

Cooling trade-off pathsA split path diagram comparing air-heavy cooling with water-assisted cooling.AI heathas to leaveAir-heavy coolingLower direct waterMore cooling electricityin hard conditionsWater-assisted coolingBetter heat handlingHigher direct water concernif evaporated
Real facilities can reduce pressure with recycled water, closed loops, efficient chips, cleaner power, and location-aware design.

Source-backed range

Electricity

Low / likely / high

Low
700 TWh/year by 2030
Likely
945 TWh/year by 2030
High
1,200 TWh/year by 2030

Approximate perspective: That is roughly enough electricity for 87,572,977 average U.S. homes for one year.

Source note: IEA base case is about 945 TWh by 2030; lower and upper values are scenario support bounds for classroom simulation.

Model note: Triangular distribution centered on the IEA base case because a full observed probability distribution is not published.

Global direct-water reporting is not strong enough here to show a sourced range, but the United States view includes water estimates.

This model is educational, not a precise forecast. Real impacts depend on model size, hardware, data-center efficiency, cooling method, electricity source, location, and usage volume. The reason high estimates are concerning is that they can mean more pressure on electricity grids, local water supplies, utility planning, and emissions targets.

Scenario caveat: This combines sourced values with transparent simulation bounds. The bounds are educational assumptions, not observed standard deviations.

Why this number varies

Exact prediction is impossible because real impacts depend on model size, hardware, data-center efficiency, cooling method, electricity source, location, and usage volume.

Global electricity

Min
700
Likely
945
Max
1,200
Mean
948
Std. dev.
102

Unit: TWh/year by 2030

IEA base case is about 945 TWh by 2030; lower and upper values are scenario support bounds for classroom simulation.

Triangular distribution centered on the IEA base case because a full observed probability distribution is not published.